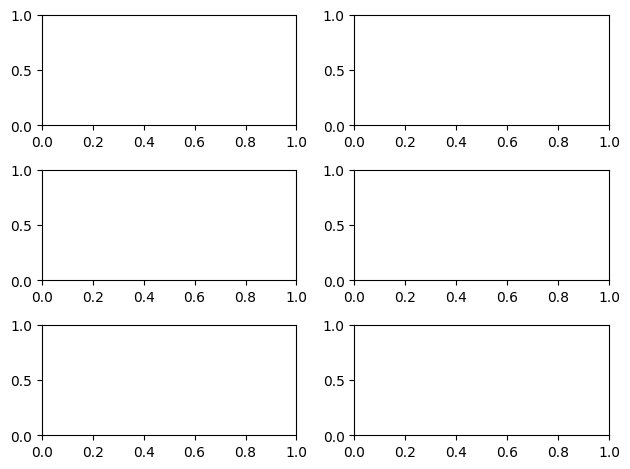
We can always create matplotlib subplots by using subplots in matplotlib. Below is an example to create a subplot of 3 rows and 2 colums.
import numpy as np
import pandas as pd
import matplotlib.pyplot as plt
fig, ax = plt.subplots(3,2,layout='tight')
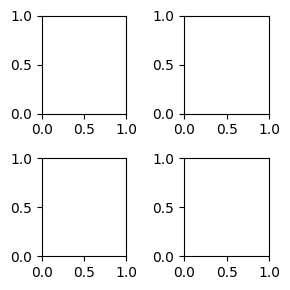
However there are times when we need fine control of subplots. This is when subplot_mosaic comes in to play. We can create any possible layout using mosaic. Below are some of the examples.
# an usual 2 by 2 grid
fig, axd = plt.subplot_mosaic(
    """
    AB
    CD
    """,
    figsize=(3, 3),
    layout="tight"
)
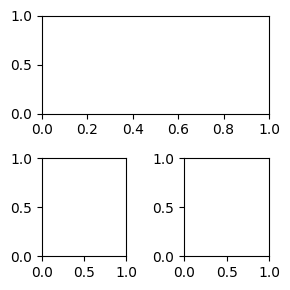
fig, axd = plt.subplot_mosaic(
    """
    AA
    BC
    """,
    figsize=(3, 3),
    layout="tight"
)
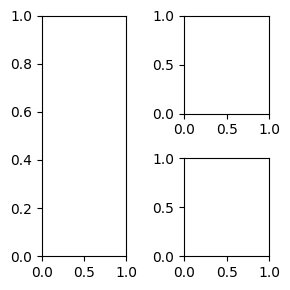
fig, axd = plt.subplot_mosaic(
    """
    AB
    AC
    """,
    figsize=(3, 3),
    layout="tight"
)
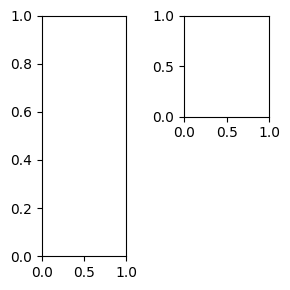
fig, axd = plt.subplot_mosaic(
    """
    AB
    A.
    """,
    figsize=(3, 3),
    layout="tight"
)
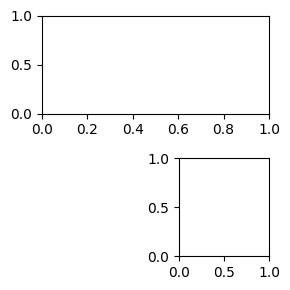
fig, axd = plt.subplot_mosaic(
    """
    AA
    .B
    """,
    figsize=(3, 3),
    layout="tight"
)
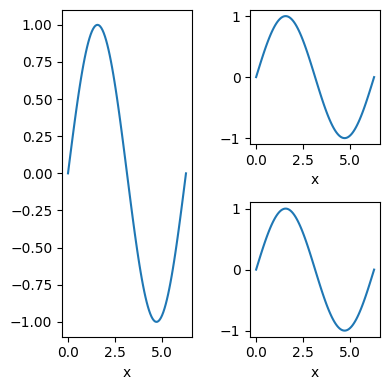
Now that we can create subplots of different layout, we would want to use them. Below is how we can loop thorugh each of the ax inside axd and do our plotting.
fig, axd = plt.subplot_mosaic(
    """
    AB
    AC
    """,
    figsize=(4, 4),
    layout="tight"
)
plt.close()
# Generate data
x = np.linspace(0, 2 * np.pi, 100)  # 0 to 2*pi with 100 points
y = np.sin(x)

# Create a DataFrame
df = pd.DataFrame({'x': x, 'y': y})

for k ,ax in axd.items():

    ax.clear()
    df.plot(kind='line',
            x='x',
            y='y',
            legend=False,
            ax=ax)


fig